
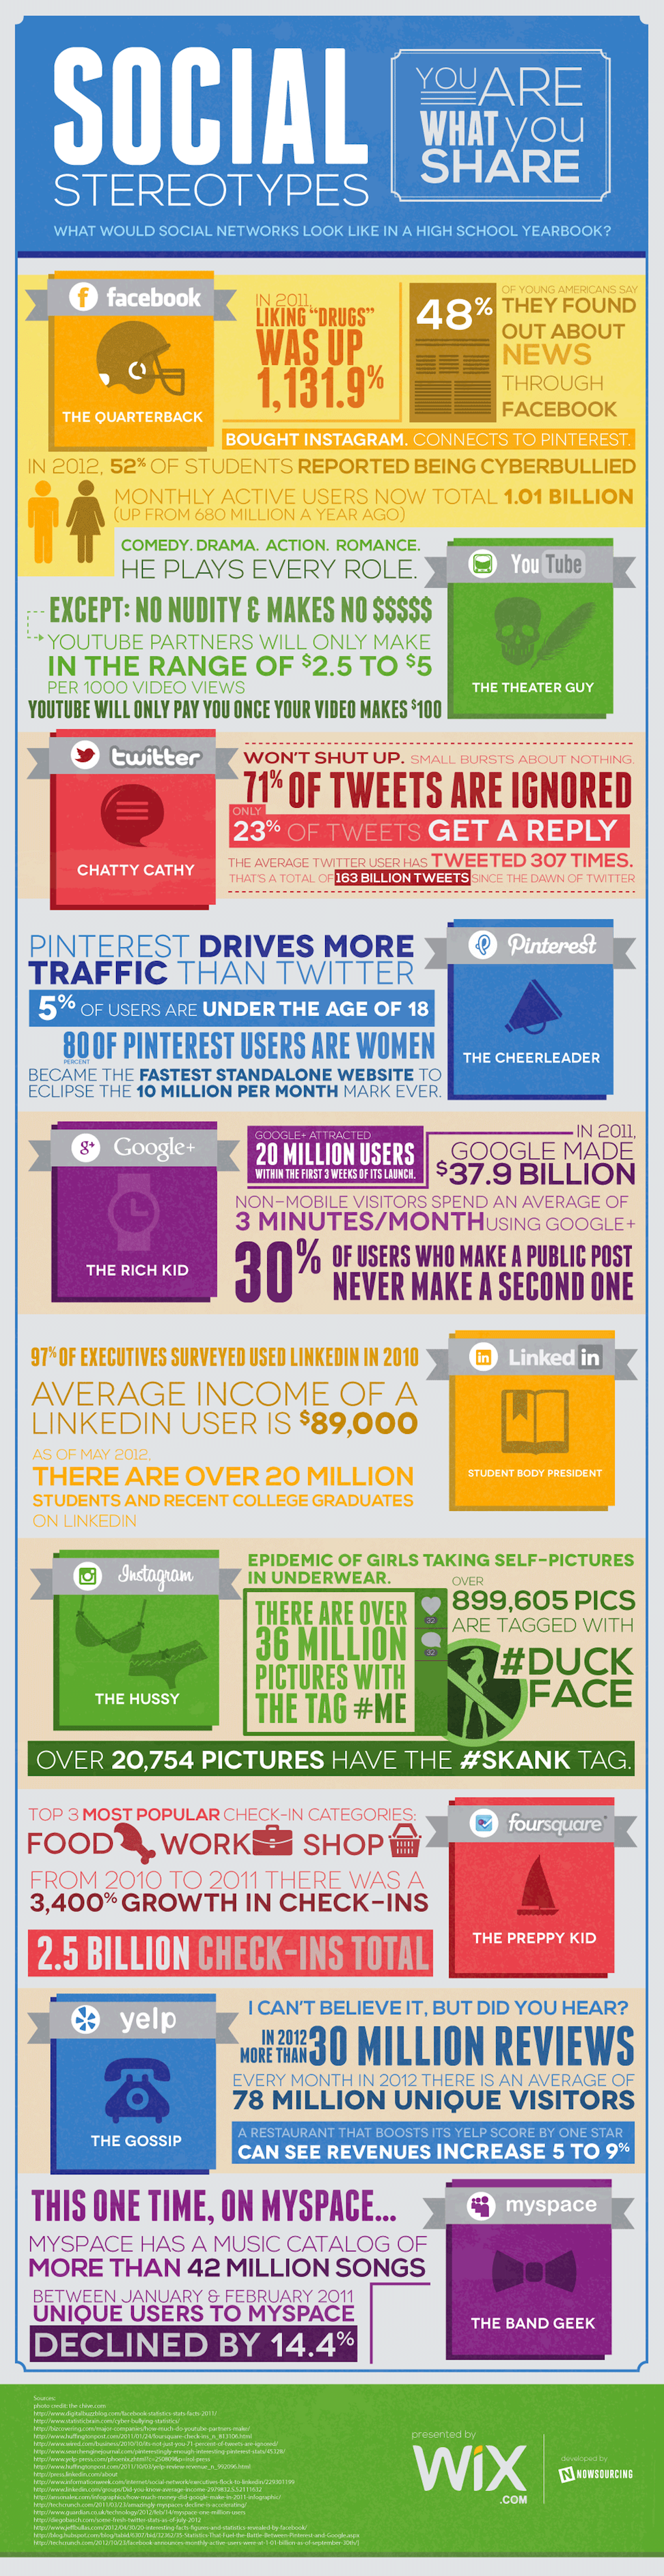
How would the top social networks rate if they were listed in a high school yearbook?
Thanks to its position as the numero uno in the social world, Facebook would be the quarterback. But it’s not all good news. In 2011, “liking” drugs on Facebook was up 1,131 percent. And while its monthly active users has jumped to over one billion in 2012, 52 percent of students reported being cyberbullied on the social network.
Twitter? Chatty Cathy. It simply won’t shut up – 163 billion tweets have been sent since it first opened its doors, but an estimated 71 percent of these have been ignored. Even more humiliating, new kid on the block Pinterest already drives more traffic to websites than Twitter.
Google+? The spoilt rich kid. Google made $37.9 billion in 2011. But almost none of that came from Google+. Last time we checked, non-mobile visitors were spending an average of just three minutes per month on the fledgling social network, and 30 percent of users who make a public post never, ever make a second one.
This infographic from Wix has a wealth of (admittedly often disparaging) social media statistics, facts and figures from the platforms above, as well as YouTube, LinkedIn, Instagram, Foursquare, Yelp and Myspace.