Residents of the Bekaa region Jeb Jennine stormed on Monday the local power plant demanding more hours of electricity, said Electricite …
Click read more for large picture
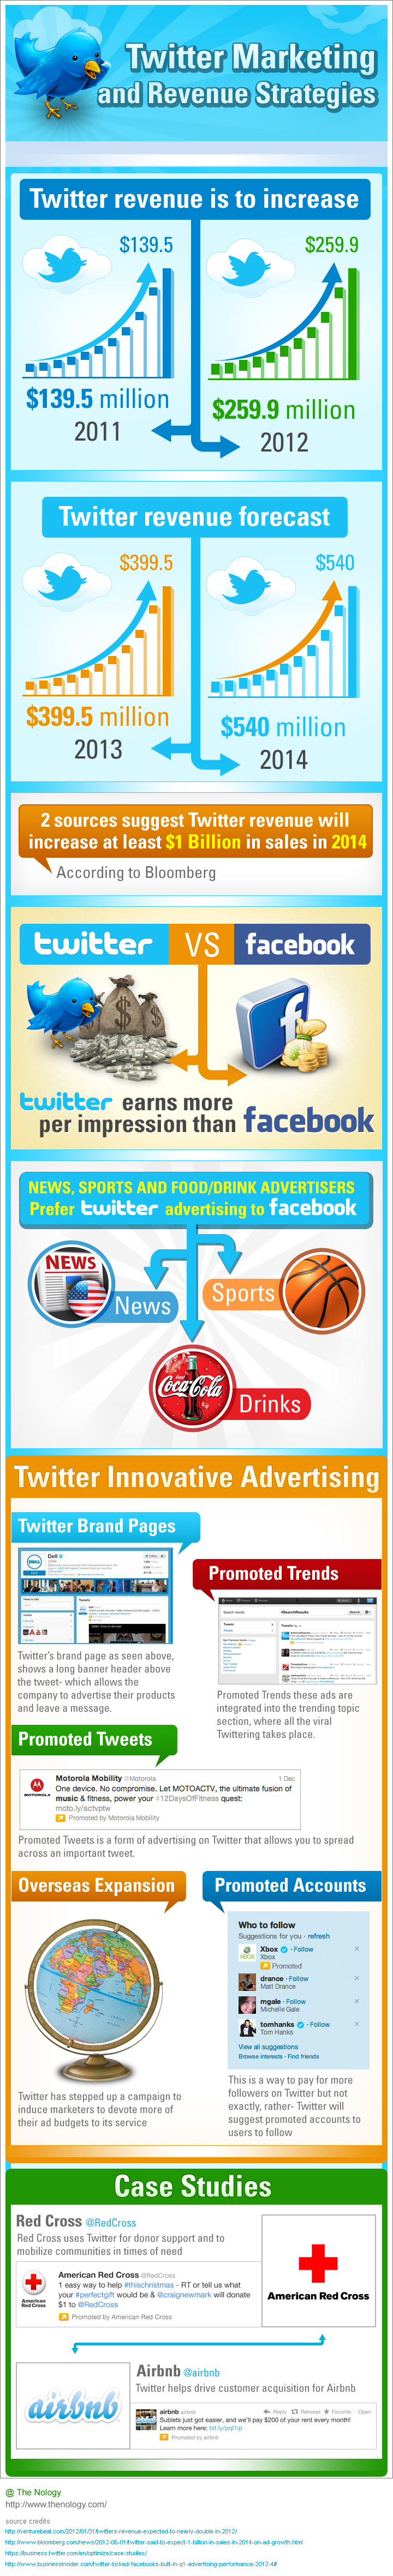
The speculation game over Twitter’s revenue is going wild. Some believe the company will bring in $226 million in revenue this year, others predict closer to $400 million, and some even think it will reach a billion in just two years.
And while it’s still private, we probably won’t be hearing any official numbers from Twitter for a while – but this infographic from TheNology.com explores what we do know.
Whether Twitter’s revenue will reach $540 million in 2014 – or whether it will explode to $1 billion as two sources told Bloomberg this month – is up for debate. The infographic explores both possibilities, and it does point out that many advertisers prefer Twitter to Facebook, which may lend credence to the high predictions.
The various types of advertising solutions on Twitter are also explored in this infographic, and a few case studies including the Red Cross and Airbnb are included to highlight how big advertisers are using Promoted Tweets, Trends and Accounts creatively.
While LinkedIn remains the top way that headhunters find talented employees, businesses with top-quality Facebook pages can attract quality applicants, too. …
Click read more to view full size picture
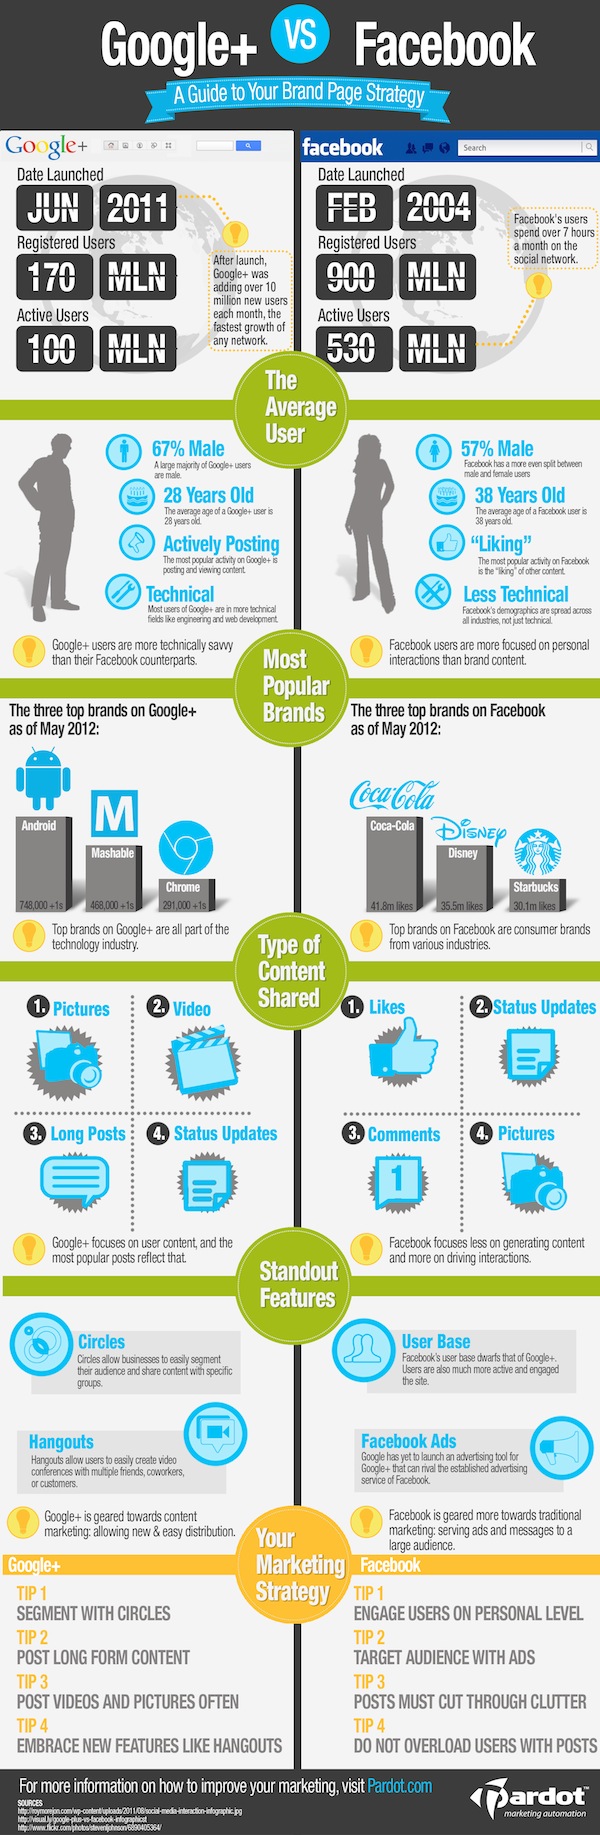
Google+ may have been slow to catch on in the wake of the larger and more popular Facebook, but don’t write the social network off just yet. This infographic shows a side-by-side comparison of the two networks, each of which caters to a slightly different audience. Which one is right for your brand?
With 170 million registered users, Google’s social layer, Google+, is finding a niche among young, tech-savvy professionals who like to post and share content. Oddly enough, pictures are what Google+ users share the most.
On Facebook, the photo-sharing feature is ranked fourth behind “likes,” status updates, and comments. Facebook users spend more than seven hours per month on the social network, engaging with one another on a personal level.
This may be why Google+ is better for promoting content, while Facebook works well for traditional marketing aimed at a broad audience. The most popular brands on Facebook are consumer favorites like Coca-Cola, Disney, and Starbucks; while Google+ favors its own products, like Android and Chrome, as well as the tech blog Mashable.
For more surprising statistics and tips for creating a marketing strategy, check out this infographic from Pardot below:


Population Movements to Keserwan - The Khazens and The Maans
ما جاء عن الثورة في المقاطعة الكسروانية
ثورة أهالي كسروان على المشايخ الخوازنة وأسبابها
Origins of the "Prince of Maronite" Title
Growing diversity: the Khazin sheiks and the clergy in the first decades of the 18th century
Historical Members:
Barbar Beik El Khazen [English]
Patriach Toubia Kaiss El Khazen(Biography & Life Part1 Part2) (Arabic)
Patriach Youssef Dargham El Khazen (Cont'd)
Cheikh Bishara Jafal El Khazen
Patriarch Youssef Raji El Khazen
The Martyrs Cheikh Philippe & Cheikh Farid El Khazen
Cheikh Nawfal El Khazen (Consul De France)
Cheikh Hossun El Khazen (Consul De France)
Cheikh Abou-Nawfal El Khazen (Consul De France)
Cheikh Francis Abee Nader & his son Yousef
Cheikh Abou-Kanso El Khazen (Consul De France)
Cheikh Abou Nader El Khazen
Cheikh Chafic El Khazen
Cheikh Keserwan El Khazen
Cheikh Serhal El Khazen [English]
Cheikh Rafiq El Khazen [English]
Cheikh Hanna El Khazen
Cheikha Arzi El Khazen
Marie El Khazen